Difference between revisions of "Dashboard"
(major revamp, new screenshots) (Tag: Visual edit) |
(dashboard screencap) |
||
| (6 intermediate revisions by 2 users not shown) | |||
| Line 1: | Line 1: | ||
| − | === https://dashboard.satnogs.org === | + | __NOTOC__ |
| + | |||
| + | == Introduction == | ||
| + | A SatNOGS dashboard website is available: | ||
| + | |||
| + | * [https://dashboard.satnogs.org/ SatNOGS Dashboard] | ||
| + | |||
| + | [[File:Satnogs-dashboard-cap.png|800px|SatNOGS Dashboard Screen capture]] | ||
| + | |||
| + | ===<span class="glyphicon glyphicon-dashboard"></span> https://dashboard.satnogs.org<nowiki/>=== | ||
We are using [https://www.influxdata.com/ InfluxDB] and [https://grafana.com/ Grafana] for our telemetry dashboards. [https://www.influxdata.com/ InfluxDB] is a time-series database designed to be efficient for time-series data like the telemetry we collect in SatNOGS. | We are using [https://www.influxdata.com/ InfluxDB] and [https://grafana.com/ Grafana] for our telemetry dashboards. [https://www.influxdata.com/ InfluxDB] is a time-series database designed to be efficient for time-series data like the telemetry we collect in SatNOGS. | ||
I'm going to drop a few things to get the reader going on telemetry dashboard in SatNOGS, and expect that the reader also reference the [https://docs.grafana.org Grafana documentation] for more details on building dashboards. | I'm going to drop a few things to get the reader going on telemetry dashboard in SatNOGS, and expect that the reader also reference the [https://docs.grafana.org Grafana documentation] for more details on building dashboards. | ||
| − | This doc also assumes you have an account to edit dashboards. You can generate an account by clicking the Sign In link. | + | This doc also assumes you have an account to edit dashboards. You can generate an account by clicking the Sign In link, and then [[Get In Touch|contacting us]] to escalate your permissions. You will be put into a group with access to the "Scratchpad - New Users" folder at first. |
Today there is a top level folder hierarchy designed as such: | Today there is a top level folder hierarchy designed as such: | ||
| Line 67: | Line 76: | ||
"Save As" will allow you to make a copy of a graph and hack on it. | "Save As" will allow you to make a copy of a graph and hack on it. | ||
| + | [[Category:Develop]] | ||
| + | [[Category:Software]] | ||
| + | [[Category:Infrastructure]] | ||
| + | [[Category:Telemetry]] | ||
| + | __NOEDITSECTION__ | ||
Latest revision as of 02:59, 20 January 2020
Introduction
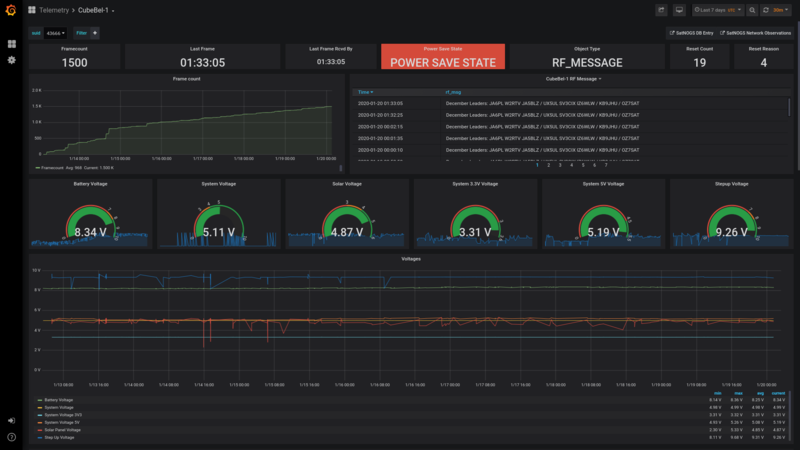
A SatNOGS dashboard website is available:
https://dashboard.satnogs.org
We are using InfluxDB and Grafana for our telemetry dashboards. InfluxDB is a time-series database designed to be efficient for time-series data like the telemetry we collect in SatNOGS.
I'm going to drop a few things to get the reader going on telemetry dashboard in SatNOGS, and expect that the reader also reference the Grafana documentation for more details on building dashboards.
This doc also assumes you have an account to edit dashboards. You can generate an account by clicking the Sign In link, and then contacting us to escalate your permissions. You will be put into a group with access to the "Scratchpad - New Users" folder at first.
Today there is a top level folder hierarchy designed as such:
- Telemetry (where telemetry dashboards should be stored, publicly accessible)
- General (for stats about our data collection itself, meta-dashboards, publicly accessible)
- Scratchpad (a playground for making grafana dashboards and testing functionality, not publicly accessible)
Creating a dashboard
Clicking the + icon will allow you to create a new dashboard. When you do this a new panel is started for you. This panel can be resized at the lower-right corner, and moved around by dragging once more panels are added.
Now - before you get started please note that you have to save your changes!! They do not save automatically!
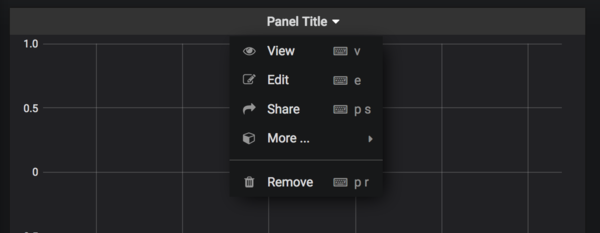
Click "Graph" to make this a graph panel. Click the graph title and then Edit to edit this specific graph.
A few things you will want to edit:
General
Give it a meaningful title, of course. Description is not required, but offers a popup of more details to the user if you want to add more details.
Metrics
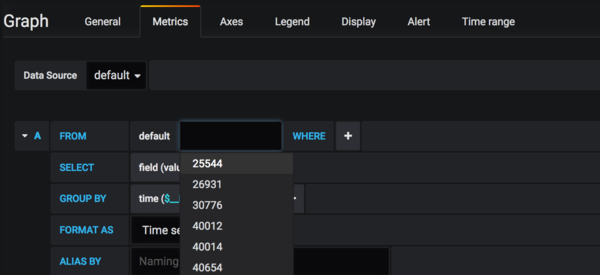
Select the metric by clicking "select measurement". What you will see here are the names of all measurements available which are the NORAD ID of the satellite in the database. You can type part of the NORAD ID to filter.
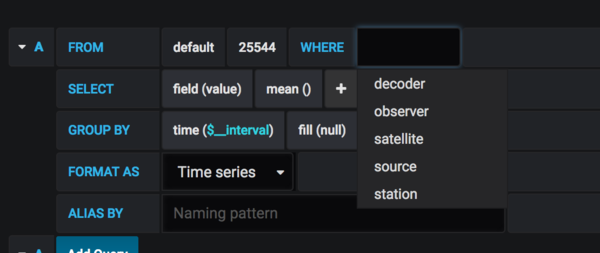
In most cases you will want to leave the WHERE clause blank, but from here you can also filter data based on the tag that the data has (such as filtering on a specific observer).
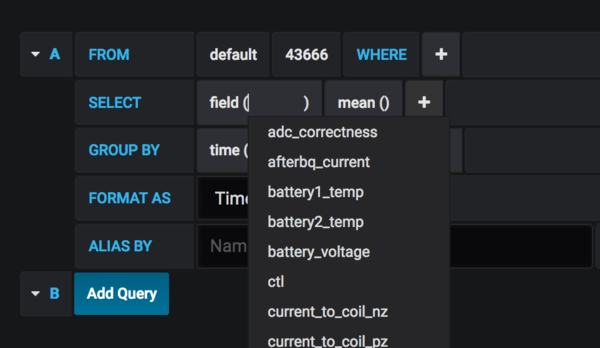
Next, select the telemetry field you are looking to graph by clicking on field("value"). If there is data in the database that has been properly decoded you should see the relevant fields for that satellite displayed here:
See any data in your graph yet? If not, change your timeframe in the upper-right corner to something like "last 30 days" as the default of "last 6 hours" may not have data decoded (especially true for our dev instance, where we have no steady stream of recent data)
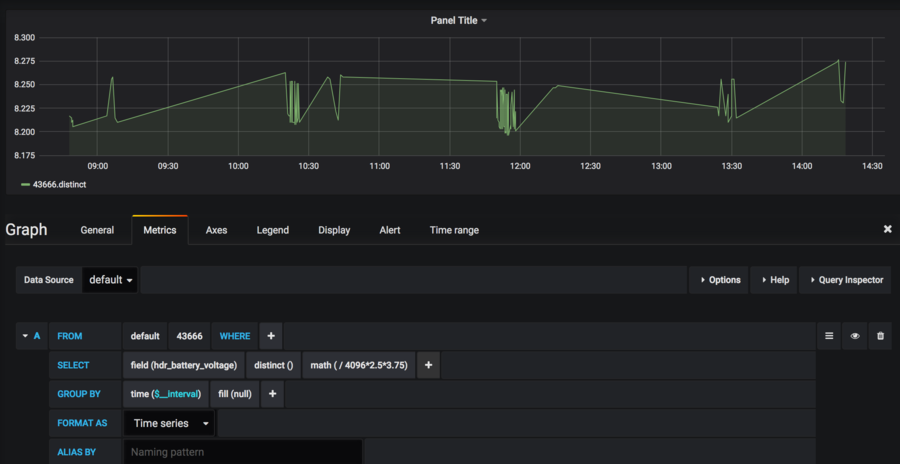
SELECT: mean() (default), distinct(), and last() are likely to be the most useful for us. Keep in mind that there is the possibility for multiple data points from multiple stations and observations, some overlapping. InfluxDB handles this for us. The timeframe selected is also taken into account in these measurements. This line is where you may need to add math to make the number human-readable. For instance, for CubeBel-1, to calculate voltage we have to take (Measured value) / 4096×2.5×3.75, which looks like this:
GROUP BY: you may wish to change the fill value here, there are a number of options. Be careful as this may be misleading to users if we are dealing with very sparse data sets, as this option will fill in any gaps, yet "none" or "linear" may be options to use to make the graphs look better.
You can also add multiple queries to the same graph with the Add Query button at the bottom
Axes
You may want to change the Unit here, as "Short" may be undesired for certain figures, and "None" would be better.
Display
If you are doing a line graph and do not want the shading below the line, change the "Fill" value here to 0.
Graph Settings
In the gear icon for a graph are the graph settings. Some things to change here:
- Name
- Folder (see the hierarchy above)
- "Now delay now-" - I suggest 30d (the last 30d) as without it the default is 6 hours
"Save As" will allow you to make a copy of a graph and hack on it.
