Difference between revisions of "Operation"
(added sample observations) |
(added TOC) |
||
| Line 1: | Line 1: | ||
| + | __TOC__ | ||
| + | |||
== Scheduling your first test observation == | == Scheduling your first test observation == | ||
Revision as of 15:26, 15 October 2017
Scheduling your first test observation
Assumptions:
- You've set up your SatNOGS client successfully
- You've created an account on the Stage Environment, created a ground station, and it's showing up as "online"
If you've run into any problems with those steps, check out the Troubleshooting page or ask for help in the community forum, the Matrix room, or on IRC at #satnogs on Freenode.
SatNOGS Network:
- Navigate your ground station page in the Stage Environment (user name -> "My Profile" -> click on the name of your ground station).
- Select the "Upcoming passes" tab.
- Look for a pass with a "schedule" button that isn't greyed out, and click it.
- In the "New Observation" page that comes up, click the "Calculate" button, then click "Schedule".
- You should now see a page for that observation; in the "Waterfall" tab, you should see "Waiting for waterfall".
Ground Station
Now SSH to your ground station computer and run these steps:
- Follow the satnogs-client logs. Depending on your setup, this might be done with
journalctl -f -u satnogs-client.service, ortail -F /var/log/supervisor/satnogs.log - Before the observation is scheduled to start, you should see your client wake up once per minute to check for new jobs:
Oct 02 00:16:02 raspberrypi satnogs-client[10124]: 2017-10-02 00:16:02,477 - satnogsclient - DEBUG - Opening TCP socket: 127.0.0.1:5011
Oct 02 00:16:02 raspberrypi satnogs-client[10124]: 2017-10-02 00:16:02,479 - satnogsclient - DEBUG - Sending message: [{"origin": "network", "transmitter": "uXJ8NQNcH8b9osRc
Oct 02 00:16:02 raspberrypi satnogs-client[10124]: 2017-10-02 00:16:02,488 - apscheduler.executors.default - INFO - Job "get_jobs (trigger: interval[0:01:00], next run at: 2
Oct 02 00:16:59 raspberrypi satnogs-client[10124]: 2017-10-02 00:16:59,615 - apscheduler.executors.default - INFO - Running job "get_jobs (trigger: interval[0:01:00], next r
Oct 02 00:16:59 raspberrypi satnogs-client[10124]: 2017-10-02 00:16:59,661 - apscheduler.executors.default - INFO - Running job "post_data (trigger: interval[0:02:00], next
Oct 02 00:16:59 raspberrypi satnogs-client[10124]: 2017-10-02 00:16:59,668 - apscheduler.executors.default - INFO - Job "post_data (trigger: interval[0:02:00], next run at:
Oct 02 00:17:00 raspberrypi satnogs-client[10124]: 2017-10-02 00:17:00,906 - satnogsclient - DEBUG - Opening TCP socket: 127.0.0.1:5011
Oct 02 00:17:00 raspberrypi satnogs-client[10124]: 2017-10-02 00:17:00,908 - satnogsclient - DEBUG - Sending message: [{"origin": "network", "transmitter": "uXJ8NQNcH8b9osRc
Oct 02 00:17:00 raspberrypi satnogs-client[10124]: 2017-10-02 00:17:00,912 - apscheduler.executors.default - INFO - Job "get_jobs (trigger: interval[0:01:00], next run at: 2
- At the scheduled time for the observation, you should see the client kick off the observation:
Oct 02 00:18:00 raspberrypi satnogs-client[10124]: 2017-10-02 00:18:00,774 - satnogsclient - DEBUG - Opening TCP socket: 127.0.0.1:5011
Oct 02 00:18:00 raspberrypi satnogs-client[10124]: 2017-10-02 00:18:00,776 - satnogsclient - DEBUG - Sending message: [{"origin": "network", "transmitter": "uXJ8NQNcH8b9osRc
Oct 02 00:18:00 raspberrypi satnogs-client[10124]: 2017-10-02 00:18:00,781 - apscheduler.executors.default - INFO - Job "get_jobs (trigger: interval[0:01:00], next run at: 2
Oct 02 00:18:22 raspberrypi satnogs-client[10124]: 2017-10-02 00:18:22,022 - apscheduler.executors.default - INFO - Running job "spawn_observer (trigger: date[2017-10-02 00:
Oct 02 00:18:22 raspberrypi satnogs-client[10124]: 2017-10-02 00:18:22,082 - satnogsclient - DEBUG - Opening TCP socket: 127.0.0.1:4533
Oct 02 00:18:22 raspberrypi satnogs-client[10124]: 2017-10-02 00:18:22,109 - satnogsclient - DEBUG - Sending message: p
Oct 02 00:18:22 raspberrypi satnogs-client[10124]: 2017-10-02 00:18:22,110 - satnogsclient - DEBUG - Received message: 0.000000
Oct 02 00:18:22 raspberrypi satnogs-client[10124]: 0.000000
Oct 02 00:18:22 raspberrypi satnogs-client[10124]: 2017-10-02 00:18:22,111 - satnogsclient - DEBUG - Opening TCP socket: 127.0.0.1:4532
Oct 02 00:18:22 raspberrypi satnogs-client[10124]: 2017-10-02 00:18:22,115 - satnogsclient - DEBUG - Sending message: P 188.276951189 -0.0155264223734
Oct 02 00:18:22 raspberrypi satnogs-client[10124]: 2017-10-02 00:18:22,119 - satnogsclient - DEBUG - Received message: RPRT -1
Oct 02 00:18:22 raspberrypi satnogs-client[10124]: 2017-10-02 00:18:22,143 - satnogsclient - DEBUG - Sending message: F 436038107
Oct 02 00:18:22 raspberrypi satnogs-client[10124]: 2017-10-02 00:18:22,144 - satnogsclient - DEBUG - Received message: RPRT 0
- After the observation is over, you should see the client submit the data to the SatNOGS network
In the SatNOGS Stage Environment, refresh the Observation page. You should now see a waterfall plot for your data.
If that all worked -- congratulations! You've just successfully completed your first SatNOGS observation.
If it didn't work, don't feel bad -- it can take a few attempts before you get it right. Have a look at the Troubleshooting page for tips, and don't forget to contact the community if you need help.
Rating observations
Once your observation results are posted back in the Network by your satnogs-client you should go to Network to rate your observations. Any orange marked observations need vetting by users.
Categories of observations:
- Good
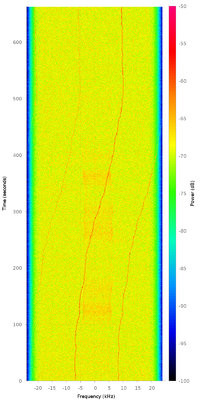
- You should mark observations as "Good" when it is clear from the waterfall and/or audio recording that a satellite is present.
- Bad
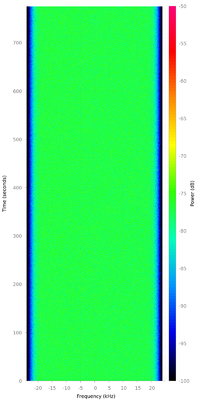
- You should mark observations as "Bad" when by examining the waterfall and/or audio it is obvious that there was no satellite detected in this observation.
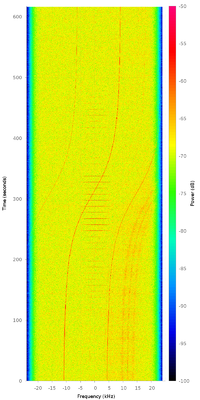
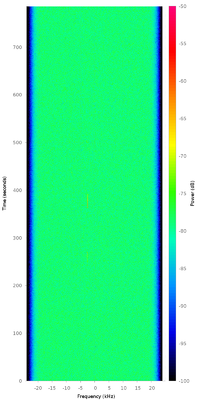
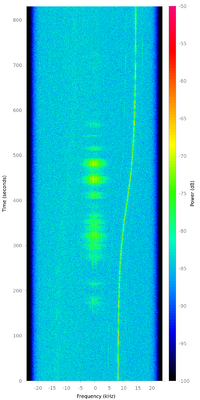
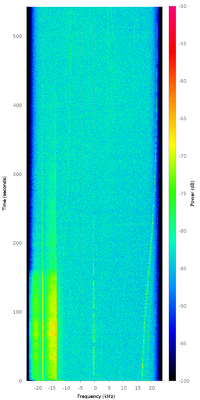
Below is a collection of waterfalls with possible results of observations:
