SatNOGS Monitor
Introduction
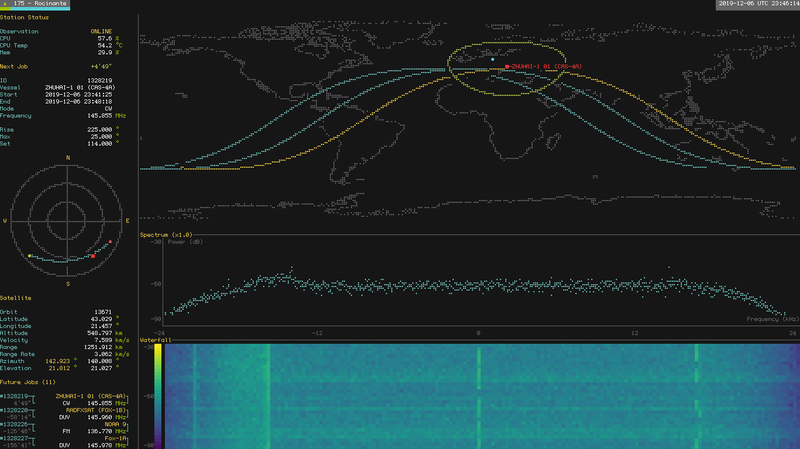
SatNOGS Monitor is a terminal ui to monitor your and/or other ground stations of the SatNOGS network. It is written in Rust and runs on Linux and has been reported to run on MacOS[1]. Windows is currently not supported by the underlying terminal library, but might be added at some point in the future. SatNOGS Monitor does not need to be installed on an actual SatNOGS station computer (although there are benefits of doing so as discussed below).
Installation
Since version 4.3-pre, there are debian packages available for simple installation.
- Copy the download link Debian package matching your CPU architecture from release page[2]
- Load package to your satnogs-station. I.e.:
wget https://github.com/wose/satnogs-monitor/releases/download/0.4.3-pre/satnogs-monitor_0.4.2-1_arm64.deb
- Install debian package with apt. Dependencies will be fetched automatically.
sudo apt install ./satnogs-monitor_0.4.2-1_arm64.deb
Building from Source
To build the monitor from source you'll need to install the Rust toolchain. Use your package manager or follow this site. Some further dependencies might be needed. Debian based systems, these are:
sudo apt-get install libglib2.0-dev cmake build-essential git
After that, you can follow allong this:
git clone --recursive https://github.com/wose/satnogs-monitor.git
cd satnogs-monitor/monitor
mkdir -p ~/.config/satnogs-monitor
cp examples/config.toml ~/.config/satnogs-monitor/
edit ~/.config/satnogs-monitor/config.toml
cargo run --release -- -s 175
Running it
You can then run the monitor over any ssh connection to your ground station or view it directly on a display attached to your RPi. See this thread for some inspiration.
The monitor makes heavy usage of braille unicode characters so make sure your terminal emulator uses a font which includes those glyphs. The screenshot at the top shows alacritty[3] with the tewi-font[4]. Take a look at nerd-fonts[5] if you're unsure about which font to use. You could also use a forked version of yaft[6] created by the same person as SatNOGS Monitor, which uses the Lucy Tewi font by default.
Monitor single station:
satnogs-monitor -s 175
Multiple stations:
satnogs-monitor -s 175 -s 227
Monitor a station on the same machine as the monitor runs (gets you more system infos):
satnogs-monitor -l 175
Monitor a local station and multiple remote stations:
satnogs-monitor -l 175 -s 227 -s 2
If satnogs-montor runs on the same machine as satnogs-client (typically a Raspberry Pi) you can set the satnogs client data path and enable the spectrum and/or waterfall plot to get a visualization of the received signal of the current observation.
satnogs-monitor -l 175 --data-path /tmp/.satnogs/data/ --waterfall --spectrum
If you have a rotator setup you can monitor the current rotator position by configuring the rotctld address:
satnogs-monitor -l 175 --rotctld-address 127.0.0.1:4533
You can also create a config file with all those informations:
mkdir ~/config/satnogs-monitor
cd ~/config/satnogs-monitor
wget https://raw.githubusercontent.com/wose/satnogs-monitor/master/monitor/examples/config.toml
edit config.toml
Check the help for more command line arguments:
$ satnogs-monitor -h
satnogs-monitor 0.4.2
Monitors the current and future jobs of SatNOGS ground stations.

USAGE:
    satnogs-monitor [FLAGS] [OPTIONS]

FLAGS:
    -h, --help         Prints help information
        --spectrum     Enables the spectrum plot
    -V, --version      Prints version information
    -v                 Sets the level of log verbosity
        --waterfall    Enables the waterfall plot

OPTIONS:
    -a, --api <URL>                        Sets the SatNOGS network api endpoint url
    -c, --config <FILE>                    Sets custom config file
        --data-path <PATH>
            Enables the spectrum and waterfall plot if set to the SatNOGS client data path
            (/tmp/.satnogs/data/)
        --db-max <DB>
            Sets the upper dB bound of the spectrum and waterfall plot (0)

        --db-min <DB>
            Sets the lower dB bound of the spectrum and waterfall plot (-100)

        --job-update-interval <SECONDS>    Polls the network for new jobs every SECONDS (600)
    -l, --local <ID>...
            Adds a station running on the same machine as this monitor with this SatNOGS network id
            to to the list of monitored stations
    -o, --orbits <NUM>                     Sets the number of orbits plotted on the map
        --rotctld-address <IP:PORT>        Enables rotator monitoring if set to a rotctld address
        --rotctld-interval <INTERVAL>      Polls the rotator position every INTERVAL seconds (5)
    -s, --station <ID>...
            Adds a station with this SatNOGS network id to the list of monitored stations

        --waterfall-zoom <FACTOR>          Zooms the spectrum and waterfall plot (1.0 - 10.0)
TAB key will cycle through available stations while SatNOGS Monitor is running.
